
The Sortino ratio measures how much return you are getting for every unit of downside risk you actually took, ignoring the upside swings that never hurt you. That makes it different from the Sharpe ratio, which punishes big winning trades the same way it punishes drawdowns, even though a huge green day is not a risk problem. For a futures trader getting stopped out on NQ or a crypto trader riding volatility on BTC, that distinction matters, because a strategy full of fat winners and shallow losses can look mediocre under Sharpe and look strong under Sortino. Prop firm traders especially need this view, since a firm cares about how deep your losing streaks run, not how exciting your best days were.
Table of Contents
What the Sortino Ratio Formula Actually Means
The formula is (Average Return - Risk-Free Rate) / Downside Deviation, and each piece pulls from your own trade log. Average return is just your mean monthly or daily P&L percentage over the period you are testing. Risk-free rate is usually a short-term treasury yield, but most active traders just use zero since they are comparing strategies, not comparing trading to holding bonds.
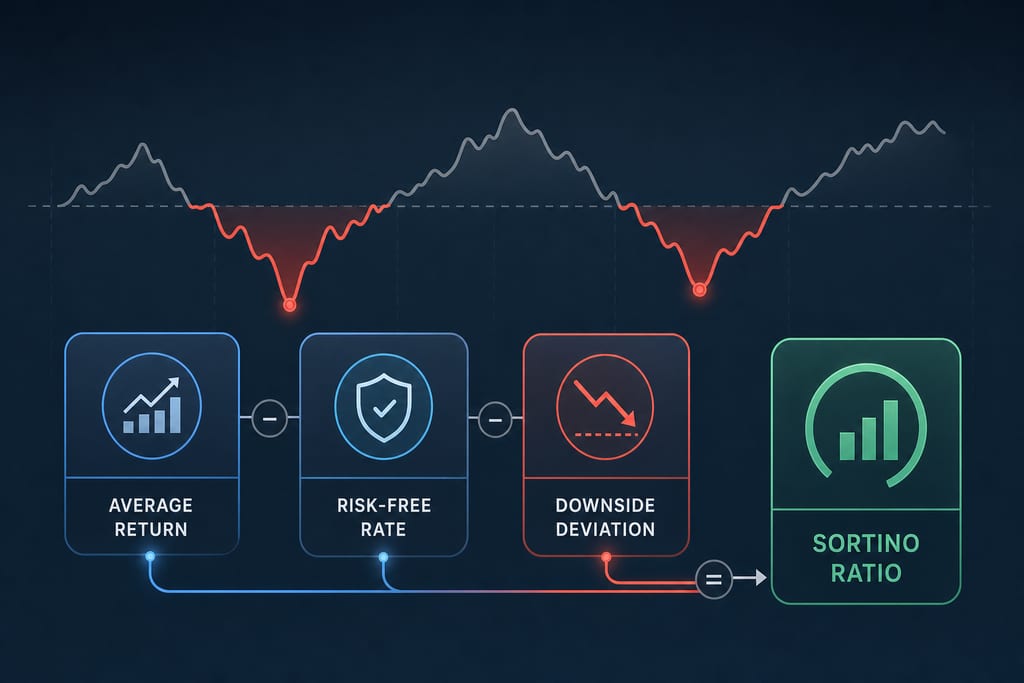
Downside deviation is the part that makes this ratio useful. It only measures the spread of your losing periods, not every up-and-down tick in your equity curve. A standard deviation calculation would punish a trader for a huge green week the same way it punishes a red week, which makes no sense if you are trying to measure risk.
Here is a quick sense check on why that distinction matters for the way you actually trade.
- Standard deviation: counts every swing, up or down, as risk
- Downside deviation: counts only losing periods as risk
- A big winning trade: hurts your Sharpe ratio, does nothing to your Sortino ratio
- A deep red day: hurts both ratios equally
For a swing trader who holds through volatility on the way to a target, this is the number that reflects what you actually felt in your account, not noise from a good week.
Running the Numbers With a Simple Trading Example
Take five months of returns: +4%, +3%, -2%, +5%, -6%. Two of those months are losers, and that is all downside deviation will look at. The average return across the five months is 0.8%, found by adding them up and dividing by five.
Next, isolate the two losing months, -2% and -6%, and calculate how far each sits below zero (or below your target return if you set one). Square those deviations, average them, then take the square root to get your downside deviation, which comes out to roughly 4.47% in this example. Divide the average return by that downside deviation and you get a Sortino ratio near 0.18, which is weak.
Walk through it in order if you want to replicate this on your own CSV:
- List each period's return, one row per month or trading day
- Flag only the negative periods
- Square each negative deviation and average them
- Take the square root to get downside deviation
- Divide average return by that number
Notice that one -6% month did more damage to this ratio than the three winning months combined helped it. That is the whole point of the metric: a single bad loss skews your score more than steady small gains can offset, which mirrors what actually happens to a prop firm account during a drawdown.
Reading Your Score and Spotting Hidden Risk
A Sortino ratio below 1 is considered weak, and anything above 2 is considered strong for active trading strategies. Between those two numbers you are in average territory, which describes most discretionary traders who have not yet tightened their risk rules.
A high win rate can still hide a bad ratio if your rare losses are large enough to wipe out many small wins, which is exactly the martingale-style trap a lot of futures and crypto traders fall into without noticing. You can win 80% of your trades and still post a Sortino ratio under 1 if the 20% you lose are oversized.
A few habits separate traders who keep this ratio healthy from traders who do not:
- Cap your max loss per trade as a fixed percent of account size
- Cut losing trades at a predetermined level instead of averaging down
- Review your worst five trades each month, not just your best five
- Track downside deviation over time, not just one month's snapshot
Running this calculation by hand every month gets old fast, which is why MyTraderScore pulls it automatically from your broker CSV export alongside drawdown and profit factor, so you see the number without rebuilding the spreadsheet yourself.
Pull Your Own Numbers Before You Trust a Guess
Open your last three to six months of broker statements and pull monthly or weekly P&L, that's the only input the formula needs. Run it by hand with the steps above, or upload the CSV to MyTraderScore and get the ratio instantly alongside drawdown and profit factor, so you are reading one risk picture instead of three disconnected numbers. A Sortino ratio by itself tells you about losing periods, but paired with drawdown it tells you how deep those losses ran, and paired with profit factor it tells you whether your edge survives them. Check it once a month, not once a year, since one bad stretch can swing the score more than your entire winning record.
Stop losing trades and start making more money.
Start freeCommon Sortino Ratio Questions
Does the Sortino ratio work with only a few months of trading history?
It works, but treat the result as a rough read, not a final grade. Three months of data can swing wildly if one losing week was unusually bad or lucky. Six months gives a steadier picture, and twelve months is better still, since it captures more than one type of market condition.
Can two traders with the same win rate end up with very different Sortino ratios?
Yes, because win rate says nothing about how big the losses are. A trader winning 60% of trades with small, controlled stops can post a strong Sortino ratio, while another trader with the same 60% win rate but one account-draining loss per month can post a weak one. The ratio cares about the size of red periods, not how often they happen.
Should futures and crypto traders aim for different Sortino targets?
No single target changes by asset class, since the formula measures your own return against your own downside, not the market you trade. A crypto account swinging through higher volatility will naturally show bigger downside deviation numbers than a futures scalper, so compare your score against your own past months rather than against traders in a different market.